Data processing software ISP-7
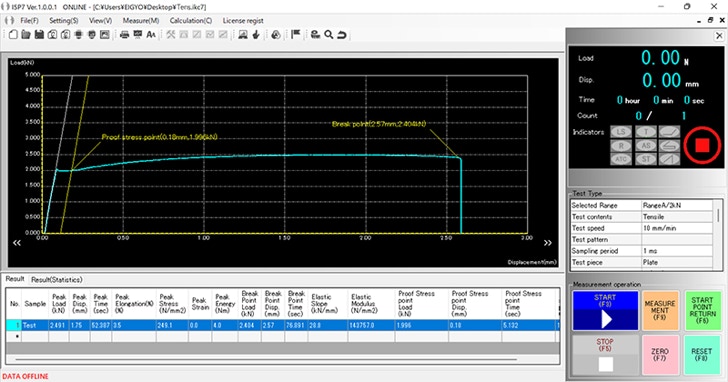
This software receives the value of load and displacement from the testing machine, and draw load-displacement curve (Stress-Strain Curve) and load-time curve.
It also processes these values and prints / saves the results.
※SV-55CB type used the designated software "Facirec".This can measure the load data only.
■Characteristics
1.Capable of processing data of "Tensile", "Compression", "Bending", and "Peeling" test.
2.During the measurement, you can see the real-time drawing of the curves.
3.Various conditions for tests can be set from the PC side, and the measurement start and end can be executed from it as well.
Because the condition setting is synchronized both on the testing machine and the PC, changes and /or updates of the condition can be done on either device.
4.Data management can be carried out in several ways, such as saving superimposed graphs from the same work in one file or in separate files.
5.By registering initially, the measurement data is to be automatically processed.
6.An operation processing result, and the graph data file can be automatically saved.
7.Each result and data can be saved as text file and graph can be converted to BMP form.
So by using commercial software, the results can be output in a preferable layout or style.
8.The calculation result or the statistic data can be checked any time, since those are displayed at the bottom of graph screen.
■Main function
(A) Graph
(B) File
(C) Setting / Measurement
(D) Calculation / Result
① The color for background and data lines, etc. can be set arbitrary.
② Enlargement of the graph can be done by clicking directly with mouse.
③ Function to let the screen-scale automatically widen or scroll.
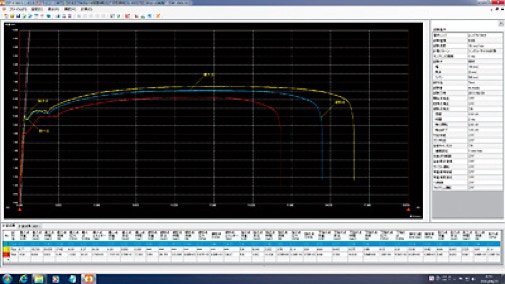
④ Function to superimposed plural data.(※1)
① The parameters of conditions and various processing can be saved / read with a specific file.
② Measured data can be saved automatically into a specified folder.
③ Measured value (load / displacement / time) are able to be saved automatically into a specific folder.
④ The value of calculation results can be saved automatically into a specific folder.
① Function to synchronize various conditions of the test and its control with testing equipment.
② By varying the number of sampling, data measurement process for a long period is possible.
③ With multiple data obtained by cycle operation, only unnecessly data can be deleted.
① Value of the load / displacement / time (Peak, Break, Yield point).
② Computing process of stress-strain, elongation rate and energy at status mentioned above (D-1).(※2)
③ Computing process of the elastic slope, modules of elasticity and proof stress.
④ Result of peeling examination; peeling load, strength, peak/bottom as well as average of max. and min. point.
⑤ Extraction of data for load, displacement or time at an arbitrary point.
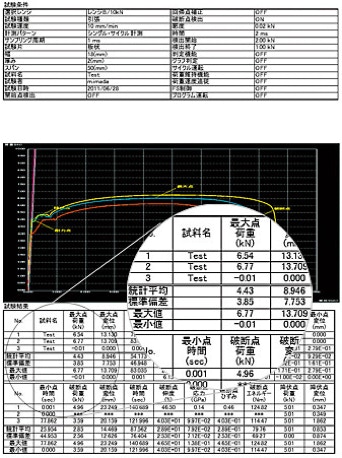
⑥ Processing the statistic average, the standard deviation as well as the maximum and minimum value from each result.
⑦ Graph judgment function to analyze the actual data graph in a specified range.
⑧ Function to detect the multiple peak values in the one examination. (consecutive measurement function)
⑨ Average graph out of several graphs from measurement can be made. (S-S average graph)
⑩ Comparison process among several data by a particular point. (measurement cursor function)
※1:There is no limit for the numbers of files to be take in, but depending on the size of the data it cannot be displayed.
※2:The calculation of the energy is not for the yield point.
S-S Graph
Print image▶
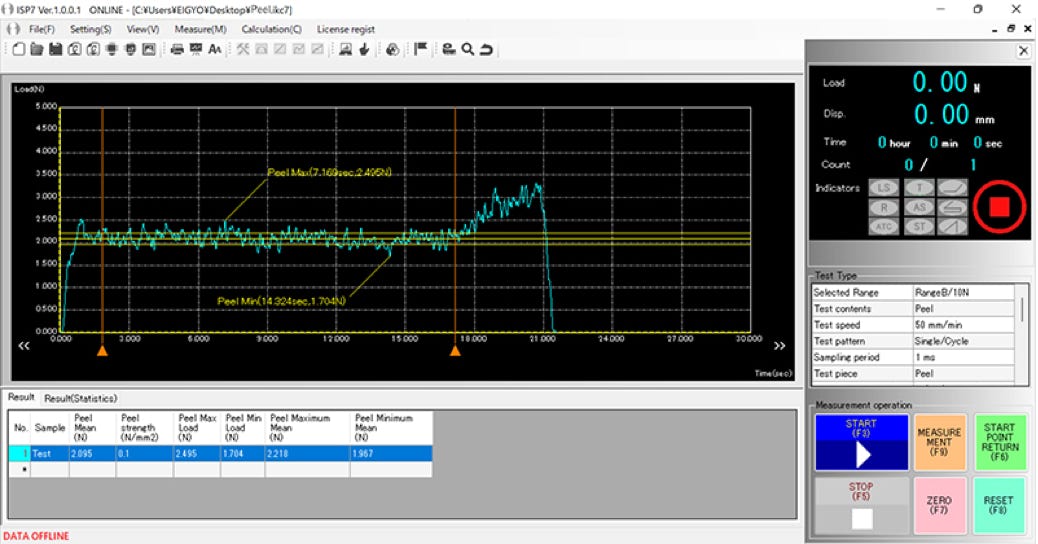
Peel test
Superimposed data graph
